How to Publish Jupyter .ipynb Notebooks to a Jekyll Static Blog
How to convert .ipynb to .md files and publish them on your static blog (with images, SVGs, etc.)
Goal: Publish a .ipynb on my Jekyll static site as painlessly as possible.
Initial Set-Up
-
Create a folder
notebooks/at the root of your Jekyll site. -
Copy these files into the
notebooks/folder. -
Install
jupyter_contrib_nbextensionspip3 install jupyter_contrib_nbextensions
How to Publish a Post
-
Create your
.ipynbnotebook within your desired_postssubdirectory.To specify metadata for your post, add a raw cell at the top of your
.ipynbfile and insert your front-matter there (i.e. everything between---and---)The root of your Jekyll project should look like:
_config.yml Gemfile |-- _site/ |-- notebooks/ |-- jupyter_to_jekyll.py |-- _posts/ |-- YYYY-MM-DD-blog-post |-- YYYY-MM-DD-blog-post.ipynb -
From the root of your Jekyll project, run:
python3 notebooks/jupyter_to_jekyll.py _posts/YYYY-MM-DD-blog-post/YYYY-MM-DD-blog-post.ipynb -
Edit the generated
YYYY-MM-DD-blog-post.mdas you see fit.Your folder structure should now look like (assuming your
.ipynbhad two images):_config.yml Gemfile |-- _site/ |-- notebooks/ |-- jupyter_to_jekyll.py |-- _posts/ |-- YYYY-MM-DD-blog-post |-- YYYY-MM-DD-blog-post.ipynb |-- YYYY-MM-DD-blog-post.md |-- markdown_images/ |-- Image 1.png |-- Image 2.png
Prior Work
First, I tried using jekyll-jupyter-notebook, but ran into a bunch of installation/processing errors and couldn’t get it to work on my Mac (running OS Catalina).
Next, I tried jupyter nbconvert --to markdown notebook.ipynb, but the default output was messy with random <style> tags and newlines.
Next, I tried this guide, but found the same styling issues as jupyter nbconvert.
Finally, I tried this guide, but I couldn’t get images to load properly – Jekyll kept giving me an error for images stored in the _posts directory that started with YYYY-MM-DD.
Combining all these approaches yielded the scripts found here
Results
This entire post was generated via the method described above from one Jupyter .ipynb notebook.
Some Code
import matplotlib
import matplotlib.pyplot as plt
import pandas as pd
import numpy as np
import seaborn as sns
Some Data Loading
Here, we load the Iris dataset from seaborn.
df = sns.load_dataset("iris")
df
| sepal_length | sepal_width | petal_length | petal_width | species | |
|---|---|---|---|---|---|
| 0 | 5.1 | 3.5 | 1.4 | 0.2 | setosa |
| 1 | 4.9 | 3.0 | 1.4 | 0.2 | setosa |
| 2 | 4.7 | 3.2 | 1.3 | 0.2 | setosa |
| 3 | 4.6 | 3.1 | 1.5 | 0.2 | setosa |
| 4 | 5.0 | 3.6 | 1.4 | 0.2 | setosa |
| ... | ... | ... | ... | ... | ... |
| 145 | 6.7 | 3.0 | 5.2 | 2.3 | virginica |
| 146 | 6.3 | 2.5 | 5.0 | 1.9 | virginica |
| 147 | 6.5 | 3.0 | 5.2 | 2.0 | virginica |
| 148 | 6.2 | 3.4 | 5.4 | 2.3 | virginica |
| 149 | 5.9 | 3.0 | 5.1 | 1.8 | virginica |
150 rows × 5 columns
Some Plots
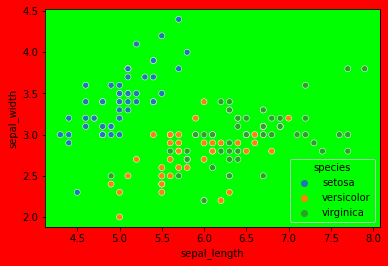
Lets set some weird default plotting color styles
plt.rcParams.update({
    "figure.facecolor":  (1.0, 0.0, 0.0),  # red   with alpha = 30%
    "axes.facecolor":    (0.0, 1.0, 0.0),  # green with alpha = 50%
    "savefig.facecolor": (0.0, 0.0, 1.0),  # blue  with alpha = 20%
})
Make a scatter plot of sepal length v. width, colored by species.
sns.scatterplot(data=df, x='sepal_length', y='sepal_width', hue='species')
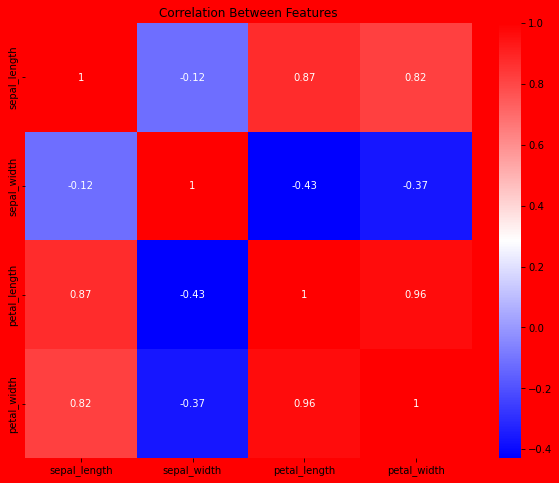
Measure the correlation between each feature.
Uses Pearson correlation:
\[r = \frac{ \sum_{i=1}^{n}(x_i-\bar{x})(y_i-\bar{y}) }{% \sqrt{\sum_{i=1}^{n}(x_i-\bar{x})^2 \sum_{i=1}^{n}(y_i-\bar{y})^2}}\]corr = df.corr(method='pearson')
fig, ax = plt.subplots(figsize=(10, 8))
plt.title("Correlation Between Features")
sns.heatmap(data=corr, annot=True, cmap='bwr')