<< Back to posts
Python Line-by-Line Profiling of a Program's Speed
How to profile your Python program line-by-line in 0 lines of code, 2 lines of shell commands
How long does each line in your Python program take to run?
Here are two super quick, user-friendly options (no code refactoring required + out-of-the-box pretty visualizations):
- cProfile + SnakeViz
- VizTracer (use this for multiprocessing)
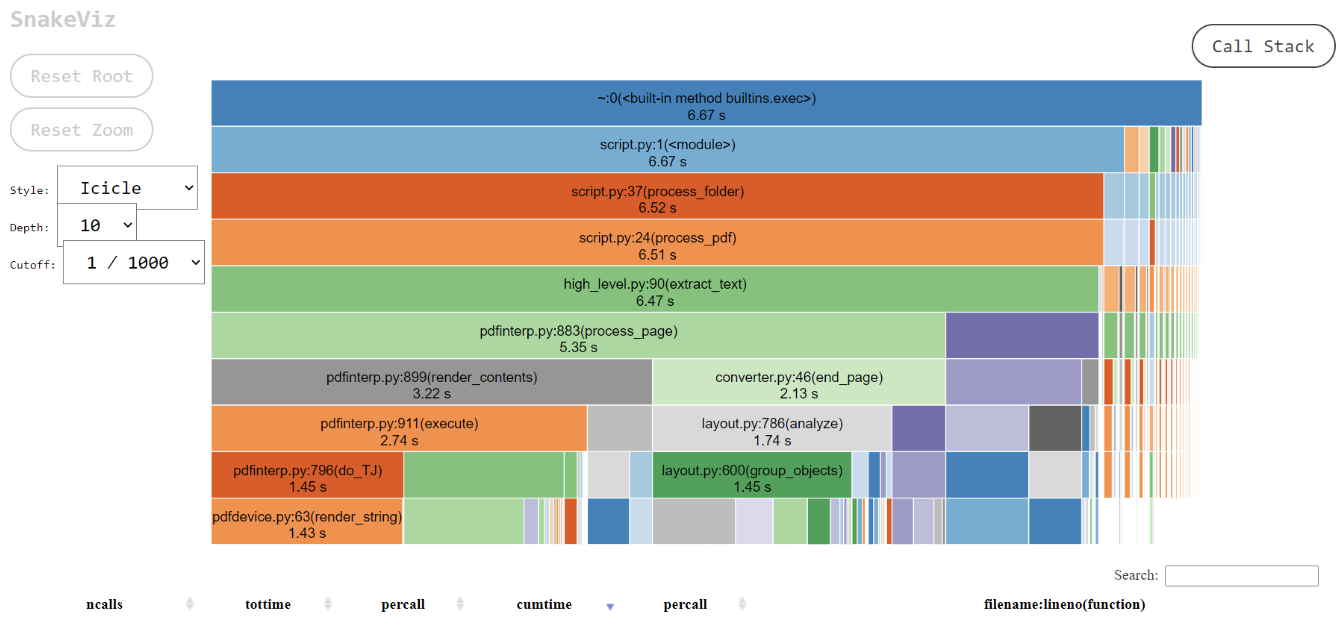
cProfile + SnakeViz
Installation
pip install snakeviz
How to Use
python3 -m cProfile -o out.prof YOUR_PYTHON_PROGRAM.py
snakeviz out.prof
You can now visit localhost:8080 in your browser to view the line-by-line heatmap for your program:
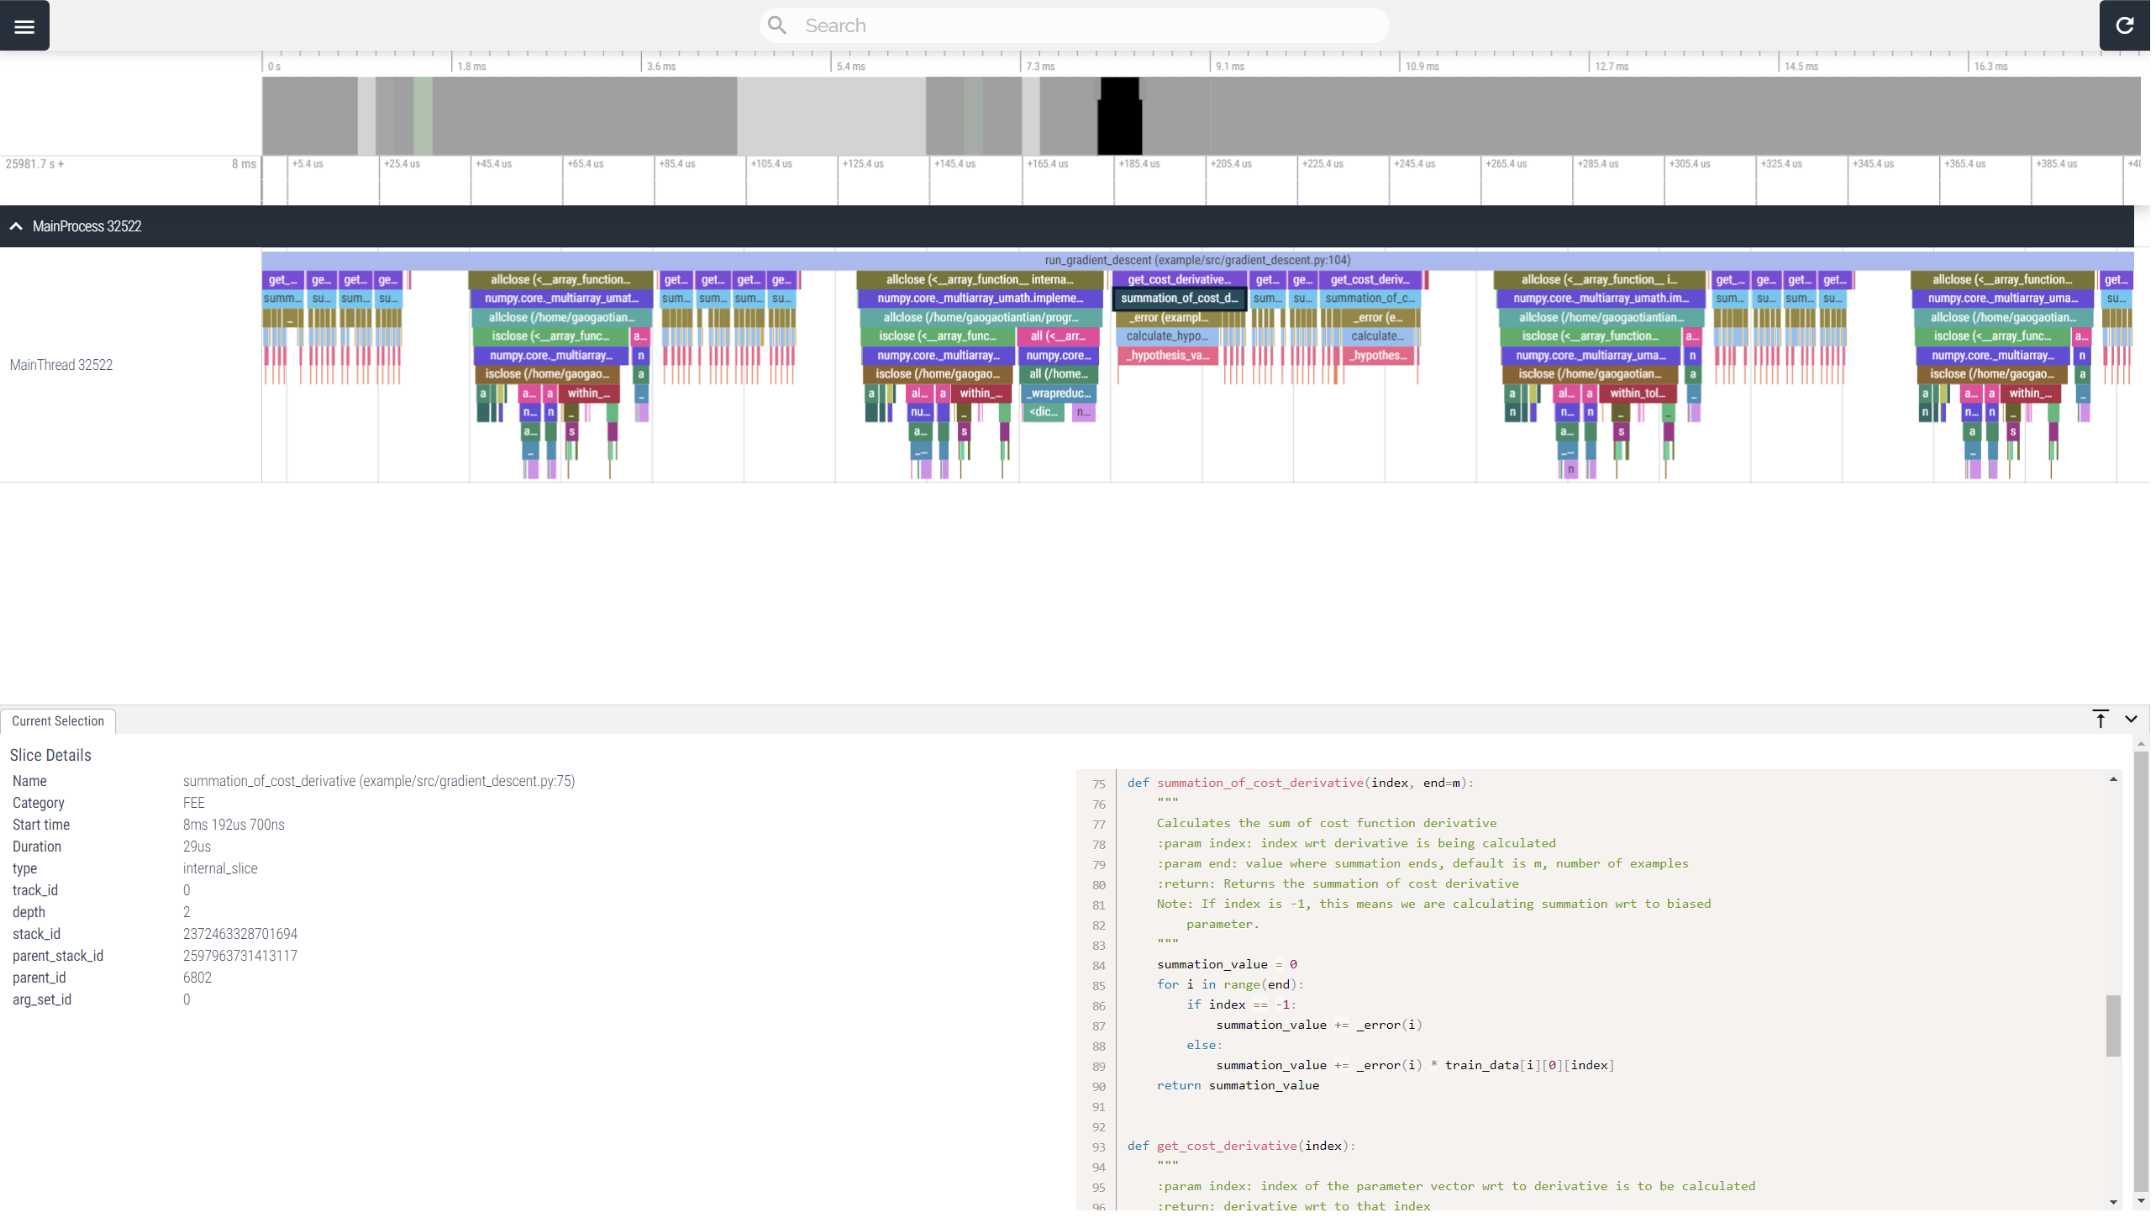
VizTracer
Note: This is better for programs with multiprocessing.
Installation
pip install viztracer
How to Use
viztracer YOUR_PYTHON_PROGRAM.py
It will then print out the command that you need to run to view your program’s output.
It will look something like this:
Use the following command to open the report:
	vizviewer PATH_TO_YOUR_PYTHON_PROGRAM/result.json
Run that command, then visit localhost:9001 in your browser to view the line-by-line heatmap for your program: